Financial Highlights
Consolidated Financial Highlights
For the Year
Millions of Yen
| 2018/3 | 2019/3 | 2020/3 | 2021/3 | 2022/3 | 2023/3 | |
|---|---|---|---|---|---|---|
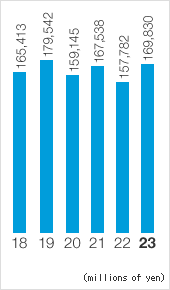
| Net sales | 165,413 | 179,542 | 159,145 | 167,538 | 157,782 | 169,830 |
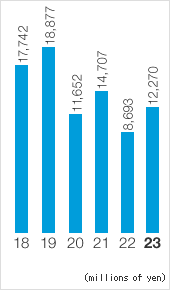
| Operating income | 17,742 | 18,877 | 11,652 | 14,707 | 8,693 | 12,270 |
| Ordinary income | 19,422 | 19,528 | 12,476 | 17,647 | 11,123 | 13,247 |
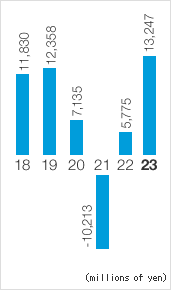
| Net income | 11,830 | 12,358 | 7,135 | -10,213 | 5,775 | 16,906 |
At Year-End
Millions of Yen
| 2018/3 | 2019/3 | 2020/3 | 2021/3 | 2022/3 | 2023/3 | |
|---|---|---|---|---|---|---|
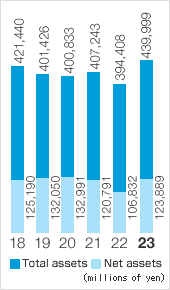
| Total assets | 421,440 | 401,426 | 400,833 | 407,243 | 394,408 | 439,999 |
| Net assets | 125,190 | 132,050 | 132,991 | 120,791 | 106,832 | 123,889 |
Per share data
Yen
| 2018/3 | 2019/3 | 2020/3 | 2021/3 | 2022/3 | 2023/3 | |
|---|---|---|---|---|---|---|
| Net income (basic) | 110.82 | 115.53 | 66.65 | -95.39 | 54.27 | 158.97 |
| Net income (diluted) | 101.99 | 106.42 | 61.29 | - | - | - |
| Net assets | 1,130.11 | 1,190.63 | 1,193.69 | 1,079.40 | 955.07 | 1107.35 |
| Cash dividends | 46 | 46 | 40 | 30 | 30 | 45 |
Financial Indicators
%
| 2018/3 | 2019/3 | 2020/3 | 2021/3 | 2022/3 | 2023/3 | |
|---|---|---|---|---|---|---|
| Return on assets (ROA) | 4.6 | 4.7 | 3.1 | 4.4 | 2.8 | 3.2 |
| Return on equity (ROE) | 10.1 | 10.0 | 5.6 | -8.4 | 5.3 | 15.4 |
| Payout ratio | 41.5 | 39.8 | 60 | - | 55.3 | 28.3 |
- In this document, "fiscal year" refers to the year ended/ending March 31.
- Figures in this document denoted in millions are rounded down to the nearest million yen.
- The figures in per share data and financial indicators are rounded to the nearest decimal place.
Net sales
Operating income
Net income
Total assets/
Net assets
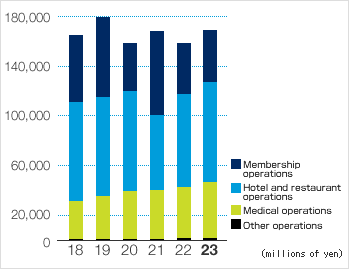
Net Sales by Segment
(Millions of Yen)
| 2018/3 | 2019/3 | 2020/3 | 2021/3 | 2022/3 | 2023/3 | |
|---|---|---|---|---|---|---|
| Membership operations | 54,114 | 64,029 | 38,948 | 66,523 | 40,946 | 34,945 |
| Hotel and restaurant operations | 79,601 | 80,383 | 80,659 | 60,322 | 73,699 | 89,747 |
| Medical operations | 30,990 | 34,478 | 38,867 | 40,022 | 42,432 | 44,422 |
| Other operations | 707 | 651 | 670 | 670 | 704 | 714 |
| Total | 165,413 | 179,542 | 159,145 | 167,538 | 157,782 | 169,830 |
Operating Income by Segment
(Millions of Yen)
| 2018/3 | 2019/3 | 2020/3 | 2021/3 | 2022/3 | 2023/3 | |
|---|---|---|---|---|---|---|
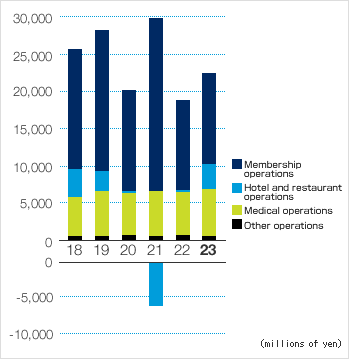
| Membership operations | 16,179 | 19,004 | 13,559 | 22,951 | 11,887 | 11,182 |
| Hotel and restaurant operations | 3,731 | 2,624 | 92 | -6,165 | 261 | 4,167 |
| Medical operations | 5,276 | 6,144 | 5,829 | 6,341 | 5,736 | 6,053 |
| Other operations | 554 | 572 | 663 | 531 | 766 | 687 |
| Head office costs | -7,999 | -9,468 | -8,491 | -8,952 | -9,959 | -9,820 |
| Total | 17,742 | 18,877 | 11,652 | 14,707 | 8,693 | 12,270 |
※After FY 2017,Operating income before the allocation of head office costs (indirect costs) is disclosed.
※In accordance with the above, we are displaying the period before FY 2016.
Net Sales by Segment
Operating Income by Segment※Excluding head office costs
